📈 US30 Daily Analysis Based on Main Key Levels – April 3, 2025
- Neom
- 4 days ago
- 1 min read
Daily Current Market Price (DCMP): 41,303 🔄
🗝️ Key Levels Summary
Below DCMP (Support)
Immediate Support: 40,997 📍
Strong Support: 40,456 🛑
Swing Low (4H/Daily): 41,400 ⚠️
Above DCMP (Resistance)
Immediate Resistance: 41,332 📍
Strong Resistance: 42,415 🛑
Swing High (Daily): 44,045 ⚠️
🔍 Technical Analysis
1️⃣ Fibonacci Zones:
Critical Fib support at 40,997 (38.2% retracement) aligns with Swing Low.
Resistance cluster at 41,332–42,415 (61.8% extension).
2️⃣ Momentum Indicators:
RSI: Neutral at 51, bullish divergence forming near 40,997 support.
MACD: Bearish crossover weakening; reversal likely above 41,332.
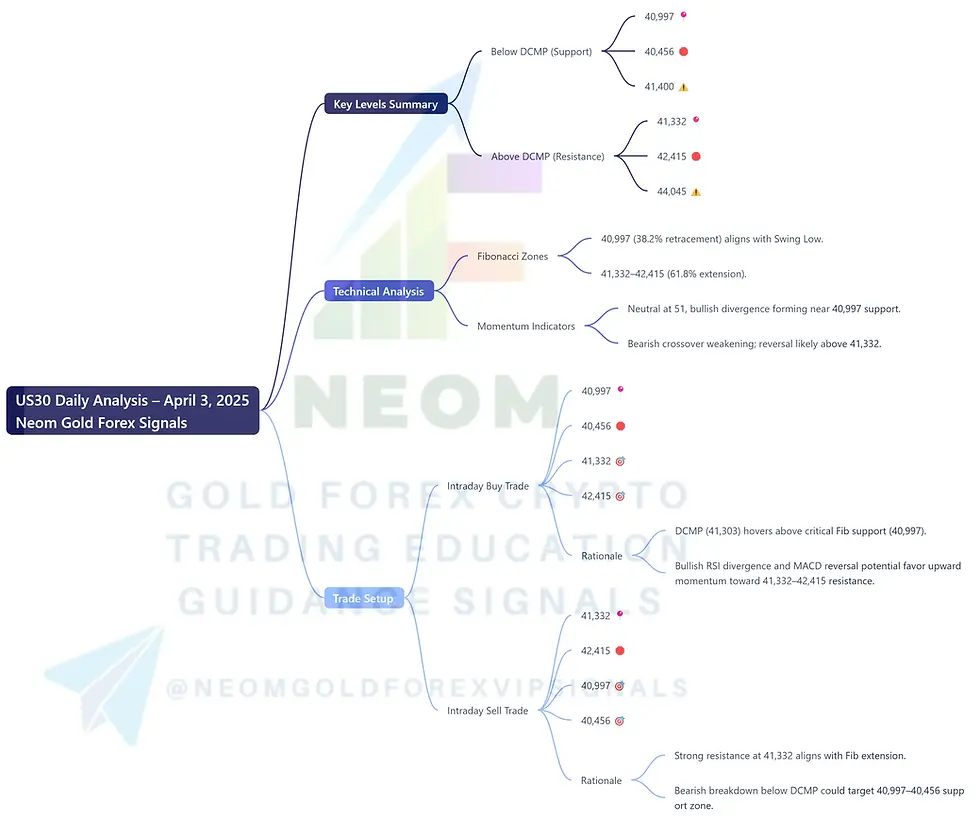
💡 Trade Setup
✅ Intraday Buy Trade
Entry: 40,997 📍
Stop Loss: 40,456 🛑
Take Profit 1: 41,332 🎯
Take Profit 2: 42,415 🎯
Rationale:
DCMP (41,303) hovers above critical Fib support (40,997). Bullish RSI divergence and MACD reversal potential favor upward momentum toward 41,332–42,415 resistance.
❌ Intraday Sell Trade
Entry: 41,332 📍
Stop Loss: 42,415 🛑
Take Profit 1: 40,997 🎯
Take Profit 2: 40,456 🎯
Rationale:
Strong resistance at 41,332 aligns with Fib extension. Bearish breakdown below DCMP could target 40,997–40,456 support zone.
📉 Critical Notes
Confirm trades with 4-hour closing prices above/below 41,303 DCMP.
Tighten stops if price breaches TP1.
🔔 Disclaimer: Analysis is educational. Verify strategies with independent research.
✨ SEO-Optimized Insights: Actionable US30 intraday trades with Fib levels and momentum indicators. Bookmark for daily strategy updates!
Comments