📈 USOIL Daily Analysis Based on Main Key Levels – March 27, 2025
- Neom
- Mar 27
- 1 min read
Daily Current Market Price (DCMP): 69.56
🔍 Key Levels Breakdown
Above DCMP (Resistance)
🎯 69.71 – Immediate Resistance (Sell Zone)
🎯 70.13 – Technical Ceiling
🎯 70.80 – Major Structural Resistance
Below DCMP (Support)
🛡️ 69.36 – Critical Support (Buy Zone)
🛡️ 69.04 – Liquidity Pool Anchor
🛡️ 68.63 – Swing Low Floor
📊 Technical Analysis Snapshot
Fibonacci Levels: Price consolidates between 38.2% Fib (69.71) and 61.8% Fib (69.36).
RSI: Neutral at 51, indicating balanced momentum.
MACD: Bullish crossover forming on 4-hour charts.
Swing Levels:
Daily Swing High: 73.11
Daily Swing Low: 66.12
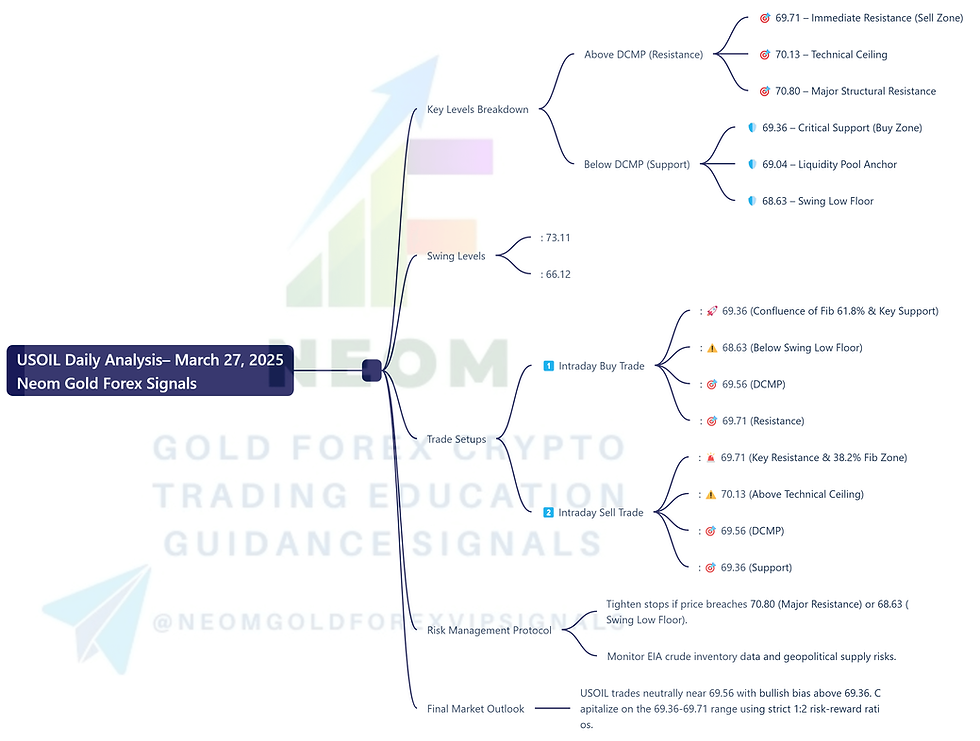
💡 Trade Setups
1️⃣ Intraday Buy Trade
Entry: 🚀 69.36 (Confluence of Fib 61.8% & Key Support)
Stop Loss: ⚠️ 68.63 (Below Swing Low Floor)
Take Profit 1: 🎯 69.56 (DCMP)
Take Profit 2: 🎯 69.71 (Resistance)
Rationale: Strong bullish reversal potential at 69.36 with bullish MACD crossover and rising volume.
2️⃣ Intraday Sell Trade
Entry: 🚨 69.71 (Key Resistance & 38.2% Fib Zone)
Stop Loss: ⚠️ 70.13 (Above Technical Ceiling)
Take Profit 1: 🎯 69.56 (DCMP)
Take Profit 2: 🎯 69.36 (Support)
Rationale: Bearish rejection expected at 69.71 with RSI divergence and overhead supply pressure.
⚠️ Risk Management Protocol
Tighten stops if price breaches 70.80 (Major Resistance) or 68.63 (Swing Low Floor).
Monitor EIA crude inventory data and geopolitical supply risks.
📌 Final Market Outlook
USOIL trades neutrally near 69.56 with bullish bias above 69.36. Capitalize on the 69.36-69.71 range using strict 1:2 risk-reward ratios.
🔔 Correlate with Brent crude and DXY index for intermarket confirmation.
Comments